
Genuine 🍊 Premium 🥝 Juicy 🍎


High-Ticket Juice Box™ — A–Z User Manual
Quick start (3 wins in 5 minutes)
Open Squeeze the Orange → fill B4–B9 → your headline appears in B11–F13 automatically.
Open Cashmere Capacity → fill B3–B6 → Clients Needed shows in E3 and Utilization % in E4.
Open Michelin Mini-Press → fill B4–B13 → click JUICY → Generate 10 Hooks → hooks appear in A16–A25.
Tip: Orange cells = you type here. Purple headers = read-only.
1) Squeeze the Orange (Offer Clarity)
Goal: auto-create a premium 1-line headline + CTA.
Inputs
B4 Ideal Buyer
B5 Painful Problem
B6 Premium Promise
B7 Timeframe
B8 Biggest Objection
B9 Proof asset or metric
How to generate the output
As soon as all six inputs are filled, the sheet auto-builds:
Headline: appears in B11–F13 (no button to press).
CTA line: appears in B15–F17.
What to do with it
Copy headline → paste on website hero, LinkedIn headline, first slide of next carousel.
If H2 completion is <100%, fill missing inputs.
2) Cashmere Capacity (Price & Capacity)
Goal: calculate clients needed and utilization.
Inputs
B3 Offer Price
B4 Monthly Revenue Goal
B5 Weekly Delivery Hours
B6 Max Active Clients
How to generate the output
After you type values, the math auto-calculates:
E3 = Clients Needed
E4 = Utilization % with color warnings
How to generate the output
If E4 > 85% (red), raise price or lighten delivery.
If E3 ≤ 5, prioritize premium sales for 5 buyers now.
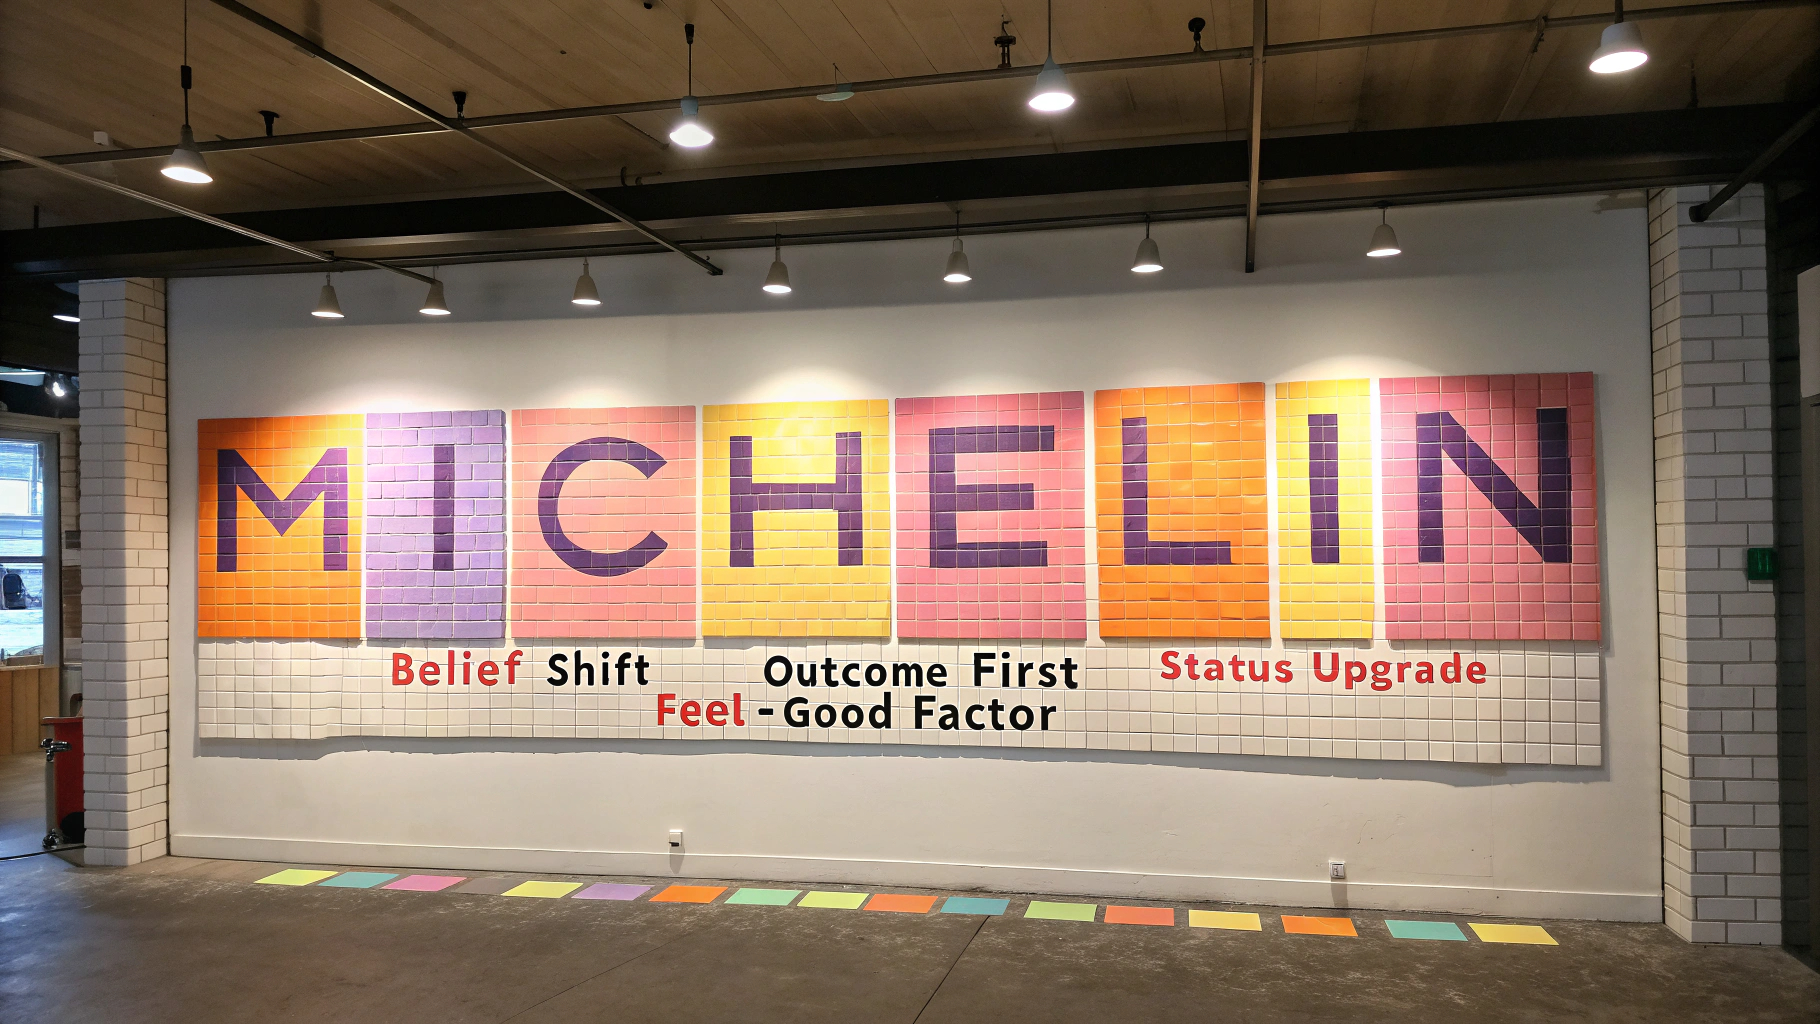
3) Michelin Mini-Press (Messaging Map Lite)
Goal: generate 10 on-brand hooks.
Inputs (B-column)
B4 Belief Shift • B5 Annoyance→Pleasure • B6 Outcome • B7 Status Upgrade • B8 Proof • B9 Feel-Good • B10 Old Belief • B11 Reframe • B12 Premium Promise • B13 Audience
How to generate the output
Fill B4–B13.
Go to menu JUICY → Generate 10 Hooks.
Hooks appear in A16–A25. Each click refreshes with new variations.
What to do with it
Copy 3 hooks → record 3 short videos today.
Use 1 hook as an email subject line.
4) Pulp-Rich Proof Bank
Goal: build “safe-to-choose” proof assets.
Inputs per row
A: Client Type • B: Result Metric • C: Proof Type (dropdown)
D: 1-Line Quote • E: Link
How to generate the output
When B + D + E are filled, F (Complete?) turns green with “Yes.”
Coverage chart updates automatically in J3:K8.
What to do with it
Aim for ≥ 5 green rows before launching or running ads.
Repurpose each row into a post: metric image + quote + link.
5) Angle Orchard (Creative Angles Generator)
Goal: turn one idea into 8 angles.
Inputs
B3 Audience Slice
B4 Core Outcome
B5 Top Objection
B6 Matching Proof
How to generate the output
The sheet auto-populates the 8 angles in E3–E10 (no button) using your inputs.
What to do with it
Record 8 x 60-sec videos (one per angle).
Copy the same text as carousel captions or email openers.
6) Conversion Cocktail Menu (CTA Matrix)
Goal: match the correct CTA to the buyer’s stage.
Inputs per row
A: Stage (dropdown)
B: Asset Type
C: CTA Flavor (dropdown)
What to do with it
Paste snippet at the end of your post/video/email.
Cover all 4 stages across a week’s content.
7) Objection Juicer (Reframe Builder)
Goal: create a 5-line talk track that disarms resistance.
Inputs per row
A: Objection
B: Root Fear
C: Reframe
D: Proof
E: Next-Step CTA
How to generate the output
The 5-line script auto-compiles in F:
Hook → Name the fear → Reframe → Proof → Invite
A carousel outline appears in G for static content.
What to do with it
Record one video per row.
Post with the proof link mentioned in D.

8) Omnipresence Spritz (7-Day Planner)
Goal: plan and measure a light weekly cadence.
Inputs per row
A: Date
B: Platform (dropdown)
C: Format
D: Hook (paste from Michelin)
E: CTA (from Cocktail Menu)
G: Status = “Done” when published
How to generate the output
I4 (Done %) updates automatically based on “Done” statuses.
What to do with it
Target ≥ 60% weekly. If below, shrink formats and batch record.
9) Pipeline Pour (Lead & Revenue Snapshot)
Goal: track movement to booked calls and revenue.
Inputs per row
A: Date
B: Lead Source
C: Status (dropdown)
D: Offer
E: Value
F: Contact
G: Next Action
H: Notes
I: Won?
J: Close Date
How to generate the output
KPI cards in M4–M7 update automatically when you add rows:
M4 Booked Calls (7d)
M5 Win Rate % (30d)
M6 Pipeline Value
M7 Revenue (7d)
What to do with it
If M4 < 3, run a top-of-funnel push using 3 hooks + CTA from Tab 6.
10) The Velvet Tap (Dashboard)
Goal: one view with nudges that tell you your next move.
Inputs
None. This tab pulls automatically from other tabs.
How to generate the output
After you’ve used Tabs 1–9, return here:
B3–E6 shows your headline
B8 Clients Needed
E3 Hook count
E5 Proof count
E7 Weekly cadence
B10, B12, B14 pipeline KPIs
G4–J9 Upgrade Nudge text updates automatically
What to do with it
Read the nudge. Do that one move today. Review weekly.
Repeatable playbooks
The “10-Hooks, 5-Proofs, 60%” Week
Generate hooks in Michelin → A16–A25.
Add 5 proof rows in Proof Bank until F = Yes.
Plan and publish in Spritz until I4 ≥ 60%.
Track leads in Pipeline; watch dashboard shift.
Fast “Booked Calls” Play
In Cocktail Menu, set Stage = Product/Most Aware → pick Book Call.
In Objection Juicer, create 3 scripts → record and post.
Update Pipeline daily → read The Velvet Tap nudge.
Troubleshooting: exactly how to trigger outputs
Nothing is calculating: check you didn’t delete formulas; if so, run JUICY → Build / Rebuild Workbook.
Dropdowns missing: make sure you’re clicking the orange cell; if lists are empty, rebuild via JUICY menu.
Hooks not appearing: you must click JUICY → Generate 10 Hooks after filling B4–B13 in Michelin.
Completion % not moving: status must be typed as Done in column G on Spritz.
Proof “Yes” not turning green: you need Metric (B) + Quote (D) + Link (E) on that row.
FAQs
No. Once B4–B9 are filled, the headline appears automatically in B11–F13.
Michelin tab, A16–A25, after you click JUICY → Generate 10 Hooks.
Omnipresence Spritz shows it in I4. Mark G = Done for each published row.
They update automatically from Proof Bank, Omni, and Pipeline. If you ever break a chart, use JUICY → Refresh Dashboard.
Quality standards
Short inputs win: one crisp sentence per field.
Numbers beat adjectives: “18 booked calls in 21 days” is better than “great results.”
Keep orange cells for inputs only. Don’t type in purple or cream outputs.
Last thing
If you want me to tune your promise, lock pricing, and ship a 90-day plan inside this exact system, tap the button on the sidebar or go to JuicyMarketingCo.com. Let’s pour that velvet revenue. 🍊✨
Want to see how our trust-first ad
strategy could transform your pipeline?
We’ll show you how to build an ad ecosystem that makes buyers feel like they already know (and trust) you —
before they ever click “Apply.”

YOU MIGHT ALSO LIKE
RELATED BLOGS
YOU MIGHT ALSO LIKE